Unit economics tells you whether one more sale makes the business financially stronger. It measures the revenue and variable costs attached to one order, customer, subscription, shipment, or transaction.
Revenue can grow while every extra unit quietly destroys cash, and this calculation exposes that problem early.
The core formulas work in Canada, Australia, the USA, the UK, and India. The inputs do not. Tax treatment, payment fees, fulfilment, returns, duties, customer acquisition, and local buying behaviour can turn the same customer-facing price into five different contribution outcomes.
This guide gives founders and operators a practical model for both ecommerce and SaaS. It also shows how to compare countries without mistaking tax or currency differences for operational performance.
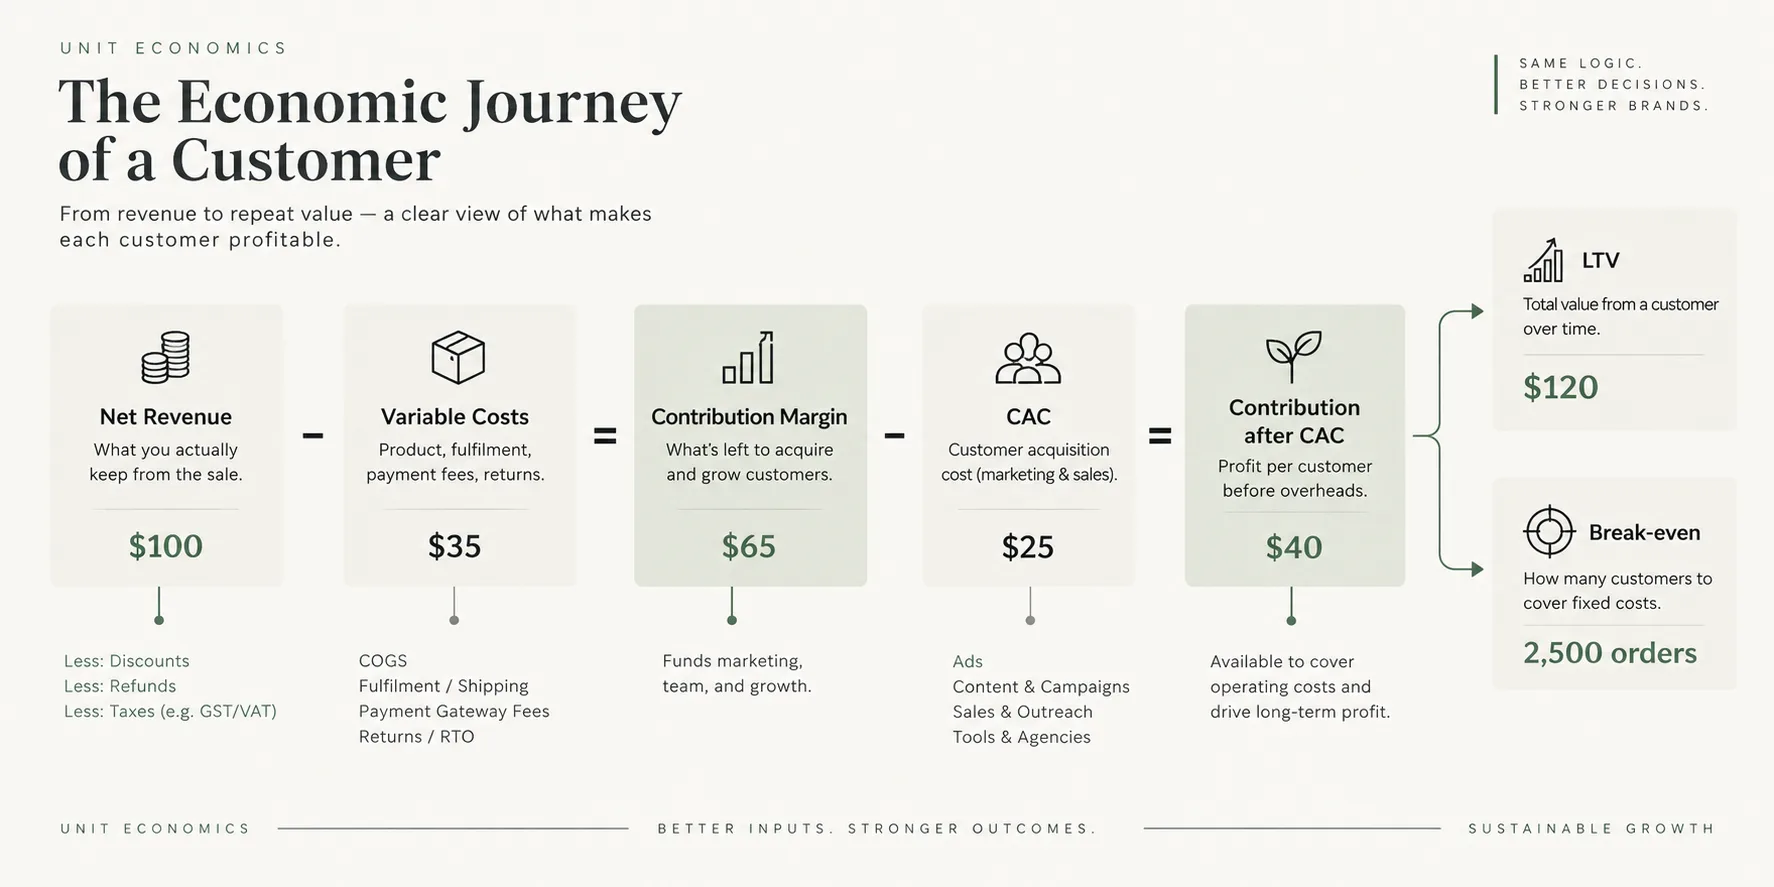
In brief
- Choose one meaningful unit before calculating anything.
- Use net revenue after discounts, refunds, and pass-through tax.
- Contribution margin, CAC, LTV, payback, and break-even answer different questions.
- Segment the result by country, channel, product, cohort, and customer type.
- Positive unit economics does not guarantee company profit. Fixed costs still need to be covered.
In this guide
- What unit economics means
- Why founders need it
- The formulas and cost layers
- A worked ecommerce example
- Ecommerce and SaaS differences
- Canada, Australia, USA, UK, and India
- A weekly, monthly, and quarterly review rhythm
- Frequently asked questions
- The free unit economics calculator
What are unit economics?
Unit economics is the revenue and variable-cost profile of one unit of business activity. The unit might be a retained ecommerce order, a paid SaaS account, a completed marketplace transaction, or a client engagement. The calculation answers a direct question: after serving one more unit, how much contribution remains?
A useful unit reflects how the business actually earns and spends money:
- Ecommerce or D2C: one delivered and retained order, product, or customer cohort.
- SaaS: one paid account, subscription, or seat per month.
- Marketplace: one completed transaction, buyer, or seller.
- Services: one project, client, or billable engagement.
Choosing the wrong unit produces a polished but misleading answer. A retailer that measures paid orders before returns will overstate contribution. A SaaS company that mixes free users with paying accounts will understate revenue per economic unit.
The time period must also match. Monthly acquisition spend should be divided by new customers acquired in the same period, and subscription contribution, churn, and retention should be compared by cohort.
Mixing annual costs with one month of results can make an efficient channel look expensive.
Why revenue growth alone can mislead
Total revenue cannot show whether the next customer is worth acquiring. Unit economics can: it turns pricing, marketing, fulfilment, retention, and expansion into decisions grounded in contribution. The U.S. Small Business Administration’s Break-even point guidance uses the same relationship between price, variable cost, fixed cost, and profit.
Founders use unit economics to answer questions such as:
- Can we afford another customer at the current CAC?
- Is a discount creating contribution or buying unprofitable volume?
- Which product, channel, or country deserves more budget?
- Does free shipping improve conversion enough to pay for itself?
- How many units are needed to cover monthly fixed costs?
- Is a first-order loss supported by real repeat purchasing?
- Will international expansion improve contribution after tax, duties, and fulfilment?
Imagine revenue grows 40%, but each new order loses $4 after variable costs and acquisition. Growth increases the loss. The sales dashboard looks healthy while cash gets tighter. The reverse can also be true: a company with slower revenue growth may generate strong contribution, recover acquisition cost quickly, and fund its next growth cycle internally.
Unit economics does not replace a profit and loss statement, cash-flow forecast, or working-capital plan. It connects individual activity to those company-level outcomes. A business may have positive contribution per order and remain unprofitable because total contribution has not yet covered salaries, rent, software, and other fixed costs.
How do you calculate unit economics?
Calculate unit economics in layers. Start with net revenue, subtract costs caused by the unit, then compare the remaining contribution with acquisition cost and fixed costs.
Do not jump straight to LTV:CAC. A ratio built on weak revenue or cost definitions creates false confidence.
1. Net revenue per unit
Net revenue per unit =
selling price
- discounts
- refunds and credits
- tax collected for government
IFRS 15 describes transaction price as the consideration an entity expects to receive, excluding amounts collected on behalf of third parties. That is why pass-through GST, HST, VAT, or buyer-imposed sales tax normally should not inflate economic revenue (IFRS Foundation, IFRS 15 Revenue from Contracts with Customers).
If a price already includes tax, a common calculation is:
Pre-tax price = tax-inclusive price / (1 + tax rate)2. Gross profit and gross margin
Gross profit = net revenue - cost of goods soldGross margin % = gross profit / net revenue x 100For ecommerce, COGS often includes product cost, inbound freight, duties, and production packaging. For SaaS, the service-delivery cost may include hosting, third-party infrastructure, and support required to provide the product. Document the policy so comparisons remain consistent.
3. Contribution margin
Contribution margin per unit =
net revenue
- COGS
- payment fees
- fulfilment and packaging
- shipping subsidy
- marketplace commission
- expected returns or RTO cost
- variable support
- other variable costs
Contribution margin % = contribution margin per unit / net revenue x 100This is the money available to fund acquisition, fixed costs, and profit. A product can have a healthy gross margin and still have weak contribution after shipping, fees, and returns.
4. Customer acquisition cost
CAC = fully loaded sales and marketing cost / new customers acquiredFully loaded CAC can include paid media, creative production, agency fees, sales commissions, influencer fees, and acquisition software. Use the costs that genuinely support new-customer acquisition, and match them to the same cohort period.
When acquisition planning needs its own scenario, compare channels with the ecommerce marketing budget calculator.
First-order contribution after CAC =
contribution before acquisition - CAC
A negative first order may still be intentional. Repeat purchases or renewals can recover it. That argument must come from observed cohort behaviour, not an optimistic spreadsheet.
5. Return and RTO drag
Expected return drag per order = return rate x net cost of one returnExpected RTO drag per order = RTO rate x net cost of one RTO shipmentThe net cost may include forward shipping, reverse shipping, payment losses, handling, damaged inventory, and non-recoverable packaging. Subtract inventory value that can genuinely be recovered.
For a deeper operating example, use the RTO cost guide alongside this allowance.
Costs founders often miss
Hidden charges usually sit between accounting systems. Check whether these items change when volume, usage, or customer activity rises:
- Commerce: inbound freight, customs brokerage, tariffs, inspection, kitting, dunnage, palletisation, storage, spoilage, shrinkage, and damaged-stock write-offs.
- Payments: card assessments, cross-border surcharges, foreign-exchange spread, chargebacks, fraud screening, refunds, instalment-provider fees, and failed-payment recovery.
- Delivery: address correction, fuel surcharge, oversized parcels, remote-area premiums, redelivery, refused consignments, reverse collection, refurbishment, restocking, and disposal.
- SaaS: cloud compute, database storage, bandwidth, observability, third-party API usage, onboarding, migration, support escalation, and service credits.
- Commercial activity: affiliate commission, marketplace levies, coupon subsidy, samples, warranty replacements, loyalty points, and customer-success hours.
Classify each item by behaviour, not by its ledger label. A monthly platform minimum may be fixed until a usage threshold is crossed, then become variable. Record that step change instead of forcing the whole invoice into one category.
6. LTV, CAC payback, and break-even
Contribution LTV =
average contribution per purchase x expected purchases per customer
LTV:CAC = contribution LTV / CACCAC payback months = CAC / monthly contribution per customerBreak-even units = fixed costs / contribution margin per unitAlways round break-even units up. Use contribution-based LTV, not revenue-based LTV. For a young company, realised cohort contribution over a fixed horizon is more defensible than an unsupported lifetime forecast.
A worked ecommerce example
The margin layers are easier to see with numbers in them. Assume a product sells for 110 in a market with 10% tax included in the customer payment. All figures below use one consistent, illustrative currency. The example is a model, not a benchmark.
| Item | Calculation | Amount |
|---|---|---|
| Customer payment | 110.00 | |
| Net selling price | 110 / 1.10 | 100.00 |
| COGS | 35.00 | |
| Gross profit | 100 - 35 | 65.00 |
| Payment fee | 3.50 | |
| Pick and pack | 5.00 | |
| Shipping subsidy | 8.00 | |
| Expected return allowance | 8% x 25 | 2.00 |
| Contribution before acquisition | 65 - 18.50 | 46.50 |
| Contribution margin | 46.50 / 100 | 46.5% |
Now assume the company spent 12,000 on acquisition activity and acquired 400 new customers.
CAC = 12,000 / 400 = 30First-order contribution after CAC = 46.50 - 30 = 16.50If monthly fixed costs are 18,600, the break-even volume depends on the order mix. Before new-customer acquisition, the model needs 400 orders because 18,600 / 46.50 = 400. If every order belongs to a newly acquired customer with a CAC of 30, the model needs 1,128 orders because 18,600 / 16.50 = 1,127.27, rounded up.
Both figures matter because a blended store normally serves new and returning customers. Applying CAC to every order understates repeat-order economics; ignoring CAC overstates growth economics. A useful dashboard separates first orders, repeat orders, and the blended company result.
Ecommerce and SaaS: same logic, different units
Ecommerce and SaaS use the same logic but different units and cost drivers. Ecommerce usually focuses on retained orders, fulfilment, returns, marketplace charges, and repeat purchasing. SaaS usually focuses on paid accounts, service delivery, churn, expansion, and CAC payback.
Ecommerce and D2C
Build the order-level cost map in this order:
- Remove tax collected from the selling price.
- Subtract discounts, refunds, and credits.
- Use landed product cost, not only the supplier invoice.
- Include payment fees and marketplace commissions.
- Add pick, pack, packaging, and shipping subsidies.
- Estimate returns, exchanges, cancellations, and RTO drag.
- Separate new-customer CAC from repeat-order contribution.
- Compare contribution with fixed costs and working-capital needs.
Segment by country, product, acquisition channel, and new versus returning customer. A product can produce strong contribution through organic search and weak contribution through paid social. A country can support a higher selling price but lose the advantage through cross-border freight, duties, and returns.
SaaS and subscriptions
Track monthly recurring revenue per account, gross margin after hosting and service delivery, usage-linked support, acquisition cost, churn, expansion, and payback.
For example, an account with 100 in monthly revenue, an 80% gross margin, and 10 in variable success cost produces 70 in monthly contribution:
Monthly contribution = 100 x 80% - 10 = 70If CAC is 700, simple payback is 10 months. The result should still be calculated by cohort, because enterprise accounts may cost more to acquire but retain longer, while self-serve customers may have low CAC but higher churn.
One blended average can describe neither segment well.
What changes in Canada, Australia, the USA, the UK, and India?
The formula is universal, but country inputs must be local. Normalize tax and currency first. Then compare fulfilment, payment fees, duties, returns, support, and CAC. Otherwise, the model may attribute a tax-display difference to operational performance.
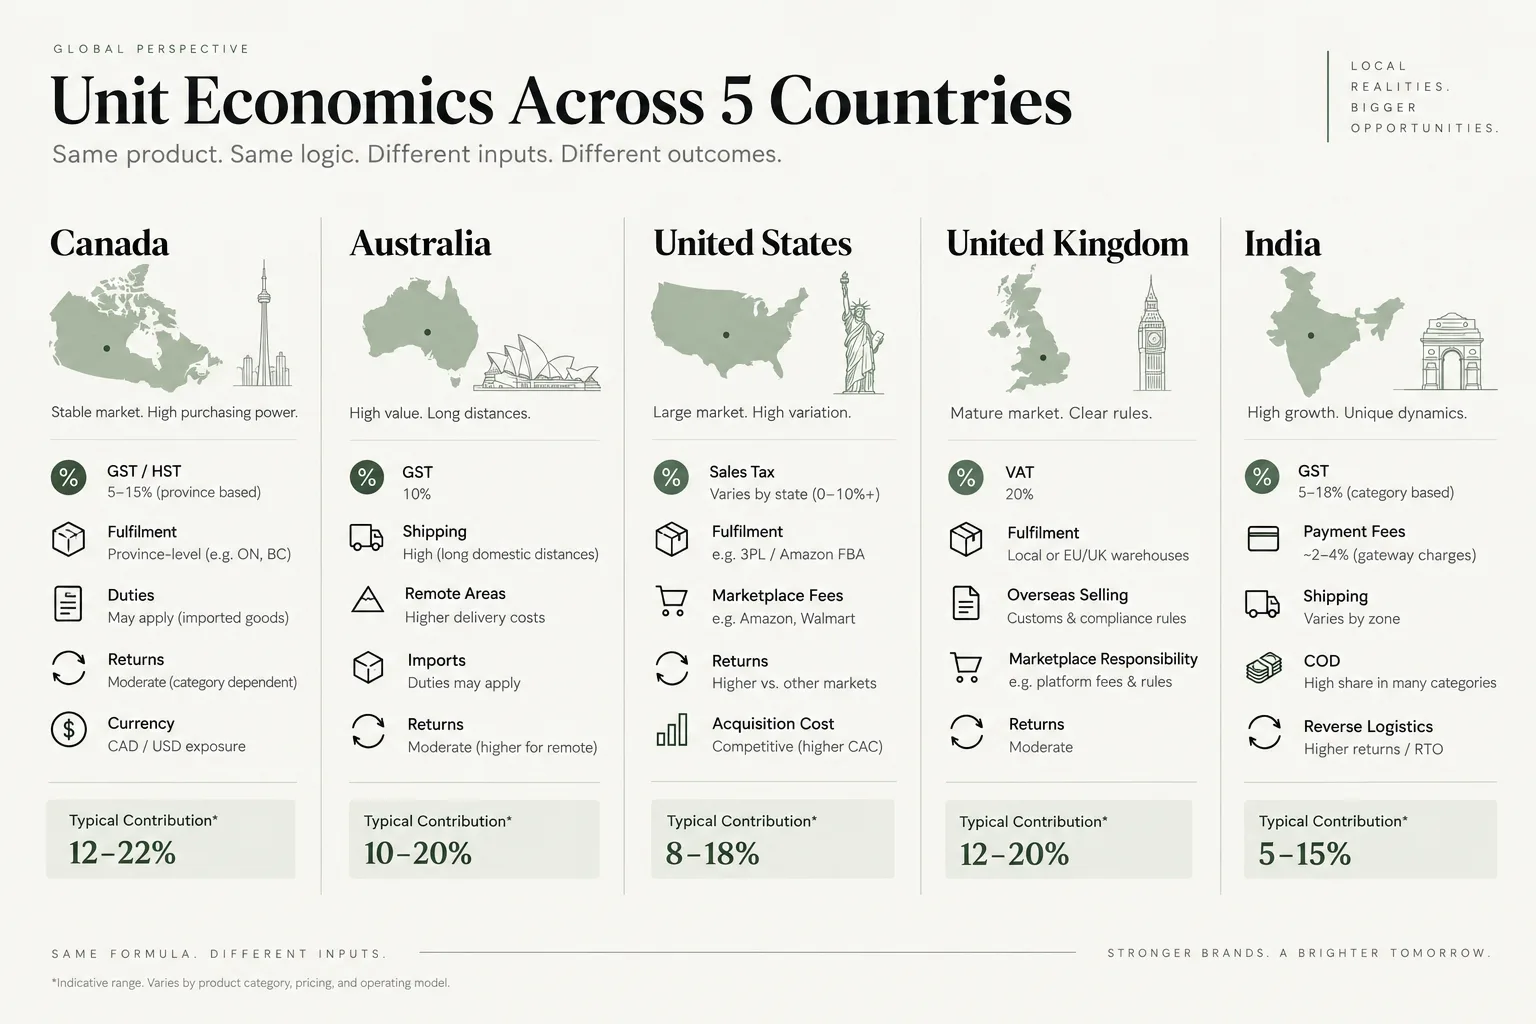
| Market | Tax treatment to model | Operating costs to watch |
|---|---|---|
| Canada | The CRA lists 5% GST in non-participating provinces, 13% HST in Ontario, 14% in Nova Scotia, and 15% in other participating provinces. Destination and supply type matter. | Province-level fulfilment, duties, returns, and CAD/USD exposure. |
| Australia | The ATO states that GST is 10% on most goods and services. GST turnover excludes GST, and registered businesses can generally claim eligible GST credits. | Domestic distance, remote-area shipping, imports, payment fees, and returns. |
| USA | There is no single national general sales-tax assumption. State and local taxability, rates, and remote-seller obligations vary by jurisdiction. | State-level fulfilment, nexus exposure, marketplace fees, and local return patterns. |
| UK | The standard VAT rate is 20%, while some supplies use a reduced or zero rate. A £120 VAT-inclusive sale at 20% contains £100 net revenue and £20 VAT. | VAT classification, fulfilment, overseas seller rules, returns, and marketplace responsibility. |
| India | GST depends on product or service classification and place of supply. Interstate and intrastate treatment differ, so one national percentage is not a safe assumption. | Marketplace commission, payment gateway fees, shipping, reverse logistics, COD handling, returns, and RTO. |
The official sources provide the current detail: Canada Revenue Agency’s GST/HST rates and place-of-supply rules, the Australian Taxation Office’s Registering for GST, IRS Publication 334, GOV.UK’s VAT rates, and India’s CBIC Know About GST.
For cross-border reporting, calculate each market in its operating currency first. Translate results at one documented rate and date for company-level comparison. Do not mix CAD revenue, USD advertising, and INR fulfilment in one row without a defined currency policy.
Recoverable input tax generally should not be treated as an economic cost. Unrecoverable duties and taxes can belong in inventory or landed cost. IAS 2 Inventories provides the accounting framework for purchase cost, import duties, and non-recoverable taxes.
Tax registration, place-of-supply, marketplace, and cross-border rules change. Use this table for operating analysis, then confirm the accounting treatment with a qualified local adviser.
Building the model into operations
Unit economics becomes useful when it is reviewed on a schedule and tied to decisions. A static spreadsheet ages quickly: prices, discounts, fees, return rates, acquisition costs, churn, and currency can all move while the formula stays unchanged.
Evidence to collect before the review
Use records that can be reconciled, not remembered estimates. Gather order exports, gateway settlements, carrier invoices, warehouse bills, refund logs, return reasons, inventory valuations, marketplace statements, advertising receipts, agency retainers, coupon reports, support tickets, subscription events, and tax filings. Match dates, currencies, customer identifiers, SKUs, campaign labels, and delivery outcomes.
Then check for timing gaps. Late courier adjustments, quarterly rebates, annual software renewals, pending chargebacks, replacement shipments, credit notes, partial refunds, cancelled orders, trial conversions, plan downgrades, paused accounts, and deferred commissions can land outside the original reporting window. Document allocation rules, exchange rates, cut-off dates, exclusions, and data owners. This audit trail makes each revision explainable and prevents a dashboard from drifting away from the ledger.
Preserve definitions in a shared data dictionary with named fields, source systems, refresh cadence, approval status, exception handling, version history, and accountable stewards.
Weekly review
- Watch net selling price after discount.
- Monitor CAC by channel and country.
- Check payment, fulfilment, return, and RTO changes.
- Flag products or plans with negative contribution.
Monthly review
- Close contribution by product, market, and acquisition cohort.
- Recalculate break-even volume.
- Compare planned and actual unit costs.
- Separate new and returning customer economics.
- Update the cash needed for acquisition and inventory.
Quarterly decisions
- Revisit pricing and free-shipping thresholds.
- Renegotiate supplier, logistics, and payment fees.
- Compare realised cohort value with the LTV assumption.
- Test sensitivity to price, CAC, returns, churn, and currency.
- Stop funding segments that remain structurally unprofitable.
Every metric should have an owner and a decision attached. CAC without a budget rule is reporting. Contribution margin without a pricing, product, or channel action is also reporting.
Frequently asked questions
What is a good unit economics ratio?
There is no universal ratio for every business. A good result produces positive contribution, covers fixed costs at a realistic volume, and recovers CAC within the company’s cash constraints. Compare the result with your own cohorts, channels, products, and payback capacity before relying on an industry convention.
Should GST, HST, VAT, or sales tax count as revenue?
Tax collected for a government generally should not count as economic revenue. Remove pass-through tax from the customer payment. Keep recoverable input tax outside unit cost, and include duties or taxes the business cannot recover. Final treatment depends on registration, classification, place of supply, and local rules.
How often should a company recalculate unit economics?
Review volatile inputs weekly and complete the full model monthly. Recalculate before entering a country, changing prices, increasing advertising, launching a promotion, or signing a contract with materially different service costs. The formula can stay constant while the inputs change quickly.
Can an order lose money while the customer remains profitable?
Yes, but only when later contribution reliably recovers the first-order loss. Ecommerce brands should verify repeat purchases by acquisition cohort. SaaS companies should verify retention, expansion, and CAC payback. A forecasted LTV cannot compensate for weak first-order economics unless observed customer behaviour supports it.
Can a business have positive unit economics and still lose money?
Yes. Positive unit economics means each additional unit contributes something after variable costs. The business can still lose money when total contribution is not large enough to cover salaries, rent, software, and other fixed costs. That is why break-even volume belongs beside contribution margin.
Calculate unit economics before you scale
The first action is to calculate one representative order with current inputs. You do not need a perfect forecasting system. Start with the last complete month, reconcile the result with settlement and cost reports.
Run the numbers without another spreadsheet
Use the MlabsGrowth Unit Economics Calculator to estimate net selling price, gross margin, contribution margin, CAC, RTO drag per order, and break-even orders.
If the numbers show that conversion or order value is the weak link, our Shopify conversion optimization service works on the pages and cart decisions between the paid click and the completed order.
The calculator focuses on immediate order economics. It does not calculate LTV or CAC payback, because those require observed repeat-purchase, retention, churn, and cohort contribution data.
The calculator lets you pick your currency. Whichever market you model, enter every monetary input in that one currency and read the outputs as a scenario model. Confirm the final local-currency treatment in your own finance records.
Once that first order reconciles, segment it. Product, channel, country, cohort, and new-versus-returning status can produce very different answers. The point is not the most detailed spreadsheet; it is a reliable answer to one operating question: does the next order or customer make the business stronger, or does growth only scale a loss?
Source notes
- U.S. Small Business Administration, Break-even point, retrieved 2026-09-19.
- IFRS Foundation, IFRS 15 Revenue from Contracts with Customers, retrieved 2026-09-19.
- IFRS Foundation, IAS 2 Inventories, retrieved 2026-09-19.
- Canada Revenue Agency, GST/HST rates and place-of-supply rules, retrieved 2026-09-19.
- Australian Taxation Office, Registering for GST, retrieved 2026-09-19.
- Internal Revenue Service, Publication 334 (2025), Tax Guide for Small Business, retrieved 2026-09-19.
- GOV.UK, VAT rates, retrieved 2026-09-19.
- Central Board of Indirect Taxes and Customs, Know About GST, retrieved 2026-09-19.
