Contribution margin is the profit left from an order after the costs that rise with each sale, and it is the number to check before you raise holiday ad spend. It tells you the highest ad cost an order can absorb, which ROAS and revenue alone cannot show.
Most stores scale on platform ROAS because it is on screen and moves quickly. The trouble is that ROAS is a revenue ratio, and platform reports count attributed revenue, not profit. A 4.0 can be profitable on one product and loss-making on another, and holiday discounts push the break-even point higher just as traffic gets more expensive.
This guide defines CM1, CM2 and CM3, walks through one order, turns the result into break-even and target ROAS, and sets a scale, hold or cut rule judged on marginal ROAS. It builds on the BFCM 2026 profit checklist and stays on the budget decision itself.
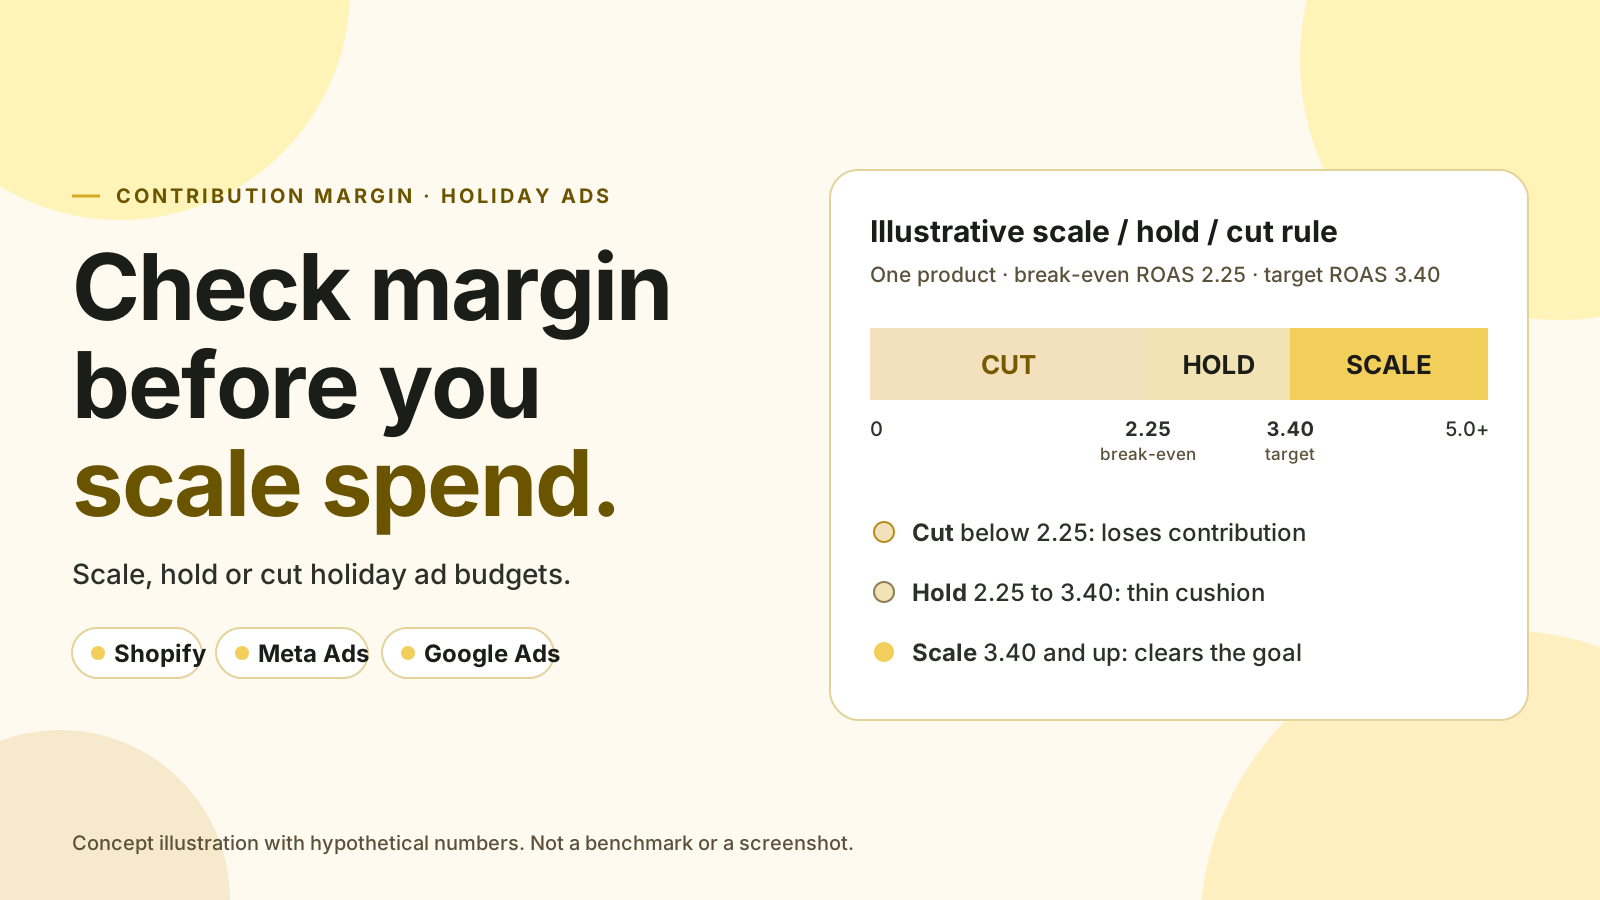
Platforms in this guide
 Shopify
 Meta Ads
 Google Ads
What are CM1, CM2 and CM3 in ecommerce?
CM1, CM2 and CM3 are successive layers of contribution margin, each subtracting more variable cost from net revenue. There is no universal standard, so naming and cut-offs vary by company. A common version is product cost first, order-handling costs second, advertising third.
Use these working definitions and keep them fixed for the whole season:
| Level | What it equals | What it answers |
|---|---|---|
| CM1 | Net revenue − product cost (COGS, including freight-in and duties if you capitalise them) | Does the product earn enough to be worth selling? |
| CM2 | CM1 − shipping and packaging − payment fees − returns and RTO allowance | What can one order afford to spend on advertising? |
| CM3 | CM2 − ad spend | Did the order actually make money after marketing? |
Net revenue means after discounts and excluding tax. Fixed costs such as salaries, rent and software stay out, because they do not change when you add one order. The unit economics guide explains why, and the landed cost calculator guide covers what belongs in product cost.
Shopify can supply part of CM1. Its profit reports depend on the cost per item you enter, and Shopify notes that they leave out ad spend and transaction fees. Treat them as a CM1 source, not as CM2 or CM3.
One holiday order, line by line
Take a product listed at ₹2,400 and sold at 15% off. Net revenue is ₹2,040. After product cost, shipping, payment fees and a returns allowance, CM2 is ₹906, or 44.4% of net revenue. Ad spend of ₹550 per order leaves a CM3 of ₹356.
Illustrative worked example (₹, one order, net of tax):
| Line | Calculation | ₹ per order | % of net revenue |
|---|---|---|---|
| List price | 2,400 | ||
| Discount (15%) | 2,400 × 15% | −360 | |
| Net revenue | 2,040 | 100% | |
| Product cost (COGS) | −720 | ||
| CM1 | 2,040 − 720 | 1,320 | 64.7% |
| Shipping and packaging | −210 | ||
| Payment fee (2%) | 2,040 × 2% | −41 | |
| Returns and RTO allowance (8%) | 2,040 × 8% | −163 | |
| CM2 | 1,320 − 414 | 906 | 44.4% |
| Ad spend per order | −550 | ||
| CM3 | 906 − 550 | 356 | 17.5% |
Every input here is hypothetical. The returns allowance is an averaged expected loss across all orders, not the refund rate; the RTO cost guide shows how to build it for cash-on-delivery orders.
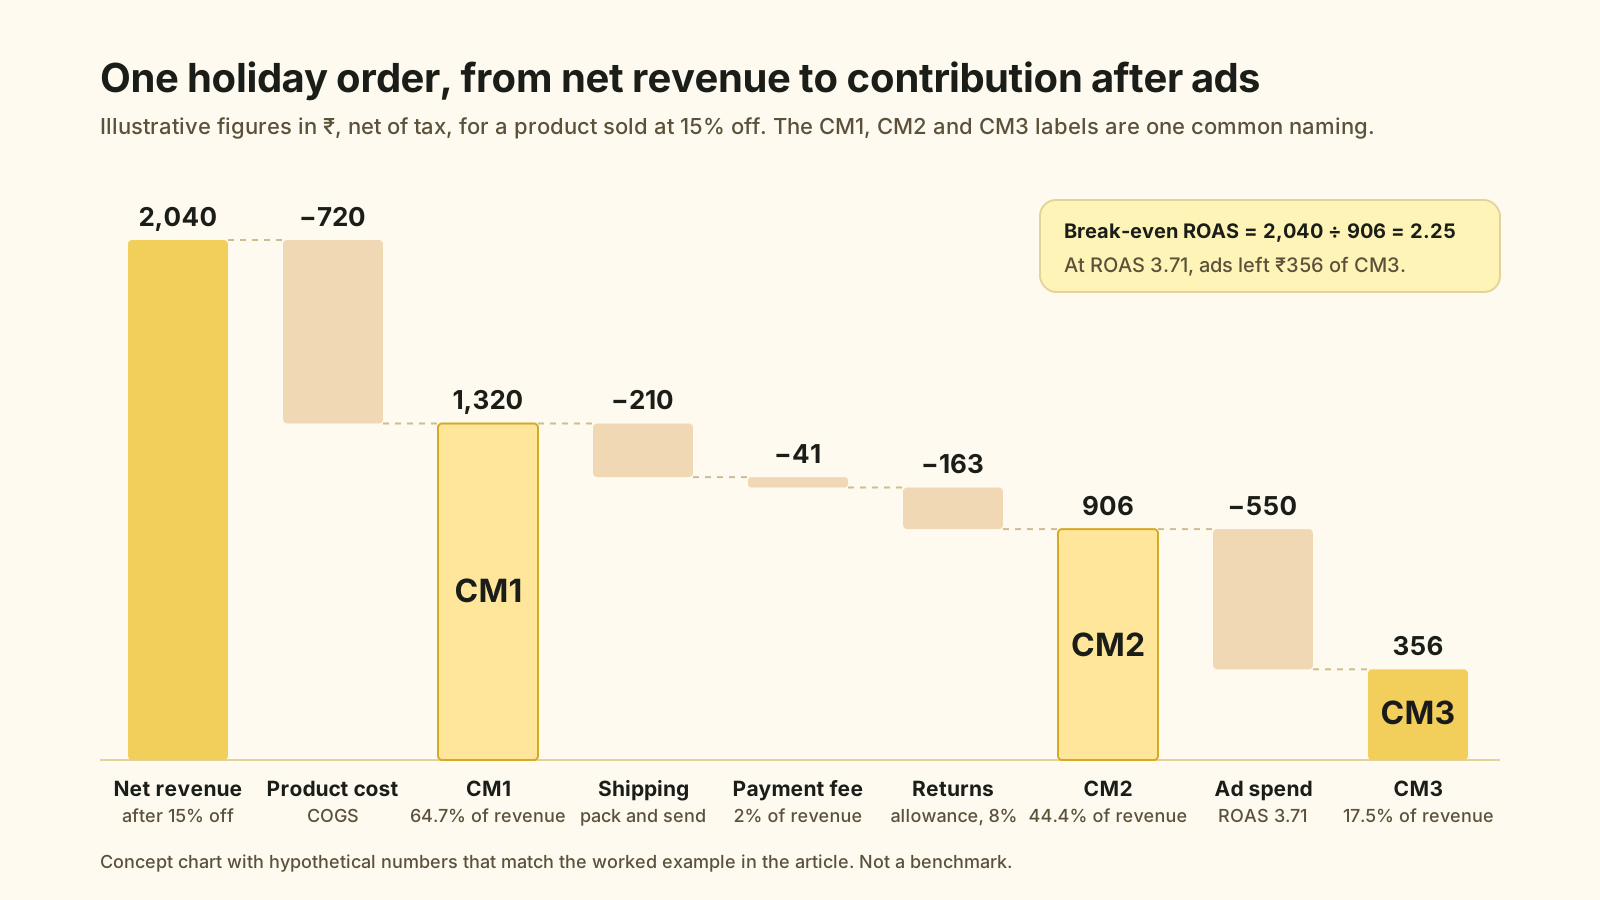
A 64.7% gross margin looks comfortable on a product page. By CM3 it is 17.5%, and on a smaller basket or a higher ad cost it could be negative.
How do you calculate break-even and target ROAS from contribution margin?
Break-even ROAS is 1 divided by CM2 as a share of net revenue. In the example, 1 ÷ 0.444 gives 2.25, equal to ₹2,040 of revenue divided by ₹906 of CM2. Target ROAS adds the CM3 you want to keep: 1 ÷ (CM2% − target CM3%).
With a goal of keeping 15% of net revenue after ads, the target is 1 ÷ (0.444 − 0.15) = 3.40. As a check, 15% of ₹2,040 is ₹306, so the order can spend ₹600, and ₹2,040 ÷ ₹600 is 3.40. The POAS versus ROAS guide explains the relationship between ROAS, break-even and POAS in more depth, so this guide only applies it to discount depth.
Discounts matter because shipping and packing costs do not fall with the price. Here is the same product at four holiday discount levels:
| Discount | Net revenue (₹) | CM2 (₹) | CM2 % | Break-even ROAS |
|---|---|---|---|---|
| 0% | 2,400 | 1,230 | 51.3% | 1.95 |
| 15% | 2,040 | 906 | 44.4% | 2.25 |
| 25% | 1,800 | 690 | 38.3% | 2.61 |
| 35% | 1,560 | 474 | 30.4% | 3.29 |
Illustrative figures, with product cost and shipping held constant and payment fees and returns at a fixed share of net revenue. A campaign that clears a 2.0 ROAS at full price can sit below break-even once the offer reaches 25%. The holiday discount strategy post covers choosing the offer itself.
Why is average ROAS the wrong number for scaling?
Average ROAS mixes your best early conversions with the marginal ones you buy at the top of the budget. A scaling decision is about the extra spend, so it should be judged on marginal ROAS: the extra attributed revenue divided by the extra spend. Average ROAS can look healthy while the last rupees lose money.
Illustrative example of a daily budget increase (₹):
| Spend | Attributed net revenue | Average ROAS | CM2 (44.4%) | CM3 | |
|---|---|---|---|---|---|
| Before | 50,000 | 200,000 | 4.00 | 88,824 | 38,824 |
| After | 70,000 | 240,000 | 3.43 | 106,588 | 36,588 |
| Change | +20,000 | +40,000 | +17,765 | −2,236 |
Marginal ROAS here is ₹40,000 ÷ ₹20,000 = 2.0, below the 2.25 break-even. Average ROAS of 3.43 still clears both break-even and the 3.40 target, so a rule built on average ROAS would say scale. The extra ₹20,000 bought only ₹17,765 of contribution.
This is also why budget rises should come in steps. Raise spend, let the data settle, compute marginal ROAS and decide on the next step. The marketing budget guide and marketing budget calculator help set the ceiling for each step.
One boundary: a first order priced below break-even can still make sense if repeat purchases repay it. That is a payback decision; model repeat orders separately with the unit economics guide. Keep it separate from a cold holiday scale decision, which rests on first-order CM2.
A scale, hold or cut rule for holiday budgets
Scale a campaign when reconciled ROAS clears your target and the last budget step cleared break-even. Hold it when ROAS sits between break-even and target. Cut it when ROAS or marginal ROAS falls below break-even across a full review period.
Set the thresholds before the sale so they are not negotiated mid-weekend.
Using the thresholds from the worked example:
| Decision | Condition (reconciled to store orders) | Example thresholds | Action |
|---|---|---|---|
| Scale | ROAS at or above target, and marginal ROAS on the last step at or above break-even | ROAS ≥ 3.40, marginal ≥ 2.25 | Raise budget in a measured step; confirm stock cover |
| Hold | ROAS between break-even and target, or the last step is unproven | ROAS 2.25 to 3.40 | Keep budget; improve offer, basket size or creative |
| Cut | ROAS or marginal ROAS below break-even for a full review period | ROAS < 2.25 | Step back to the last profitable level; do not chase with new offers |
Three conditions sit under the rule:
- Use enough data. Define a minimum number of purchases or days before any decision. Avoid cutting on a partial day.
- Check stock first. Scaling into a stock-out wastes spend. The BFCM checklist covers lead times.
- Recompute when inputs change. A courier rate rise, a stacked discount or a longer return window changes CM2 and every threshold above.
The same logic applies to the ad set, campaign and product-family levels. Use one set of thresholds per margin band, not one for the whole store.
Where Meta and Google reporting part ways with contribution
Ad platforms report the conversion value you send, credited to their own ads under their own attribution rules. They do not know your shipping cost, payment fees, returns or other channels. Contribution margin is built from store data, so the two will disagree, and the gap is what you need to manage.
| Meta Ads Manager | Google Ads | Contribution margin | |
|---|---|---|---|
| Revenue counted | Purchase value sent by pixel or server events, within the ad set’s attribution setting | Conversion value sent by your tag | Net revenue after discounts, refunds and tax |
| Costs considered | Ad spend only | Ad spend; gross profit only if you use cart data and COGS | All variable costs plus ad spend |
| Credit rule | Attribution setting on each ad set | Its own conversion tracking | Real orders, plus incrementality tests where you run them |
Some specifics are worth knowing:
- Google’s ROAS is value over cost. Google defines target ROAS as conversion value divided by cost, multiplied by 100%, and says to set it from business goals and historical performance. It does not tell you your break-even.
- Google can show gross profit, but only gross. With conversions with cart data and a cost of goods sold feed attribute, Google Ads reports gross profit, calculated as revenue minus COGS. That is CM1, not CM2 or CM3. The POAS guide covers the setup.
- Meta changed what counts as a click. In a 3 March 2026 announcement, Meta said click-through attribution for website and in-store conversions would include only link clicks, with other interactions moving to a new engage-through category. It said the change would roll out from later in March 2026. Comparisons against earlier periods may not be like for like.
- Meta points to incrementality. The same announcement calls experiments such as Conversion Lift “the gold standard in measurement”. Attribution settings, explained in Meta’s attribution help page, describe credit, not what would have happened anyway.
Check what value your tag sends. If it includes tax or shipping, break-even ROAS on net revenue will not match what the dashboard shows. Then add up platform-reported purchases for a day and compare them with store orders: if the platforms claim more orders than you received, credit is overlapping.
Keeping the numbers honest during the sale
Keep a single daily sheet that starts from store orders and ends at CM3, and refresh the inputs that move fastest: discount depth, shipping cost per order and the returns allowance. Returns are the slowest to show, so use a forward allowance now and true it up later.
For the returns allowance, avoid your year-round rate. The NRF expected 17% of 2025 holiday sales to be returned, with an estimated 19.3% of online sales returned across 2025. Those are US retail-wide numbers, not your store, but they are a reason to check your holiday rate by category. Shopify’s return window override guide covers holiday return policy choices.
A daily routine that fits into 15 minutes:
- Pull yesterday’s store orders, net revenue and discounts.
- Apply current cost per item, shipping and payment-fee inputs to get CM2.
- Divide by ad spend from each platform to get reconciled ROAS and CM3.
- Compare with break-even and target, then mark each campaign scale, hold or cut.
- Log the reasons, so January’s review knows what worked.
The unit economics calculator gives the CM2 baseline per product, and the Shopify conversion audit checklist helps confirm that purchase tracking is sound before you trust the dashboards.
A pre-sale margin check
Before you raise any budget this season, work through this list for your top products at their holiday prices. Each line comes from a rule above.
- CM1, CM2 and CM3 are written down, with the costs in each level defined in writing and fixed for the season.
- Break-even and target ROAS are set per product or margin band, not one figure for the whole store, and recalculated for every discount level you plan to run.
- The returns allowance uses a holiday rate checked by category, not your year-round rate.
- Scale, hold and cut thresholds are agreed, along with the minimum number of purchases or days before any decision.
- Budget rises are planned in steps, each judged on marginal ROAS against break-even rather than on the campaign average.
- Stock cover is confirmed for anything you expect to scale.
- The tag value is checked for tax and shipping, and a day of platform-reported purchases has been compared with store orders.
- The daily sheet from store orders to CM3 is ready, with the fast-moving inputs in one place.
Platform dashboards remain useful for speed, but they count attributed revenue, not profit. With the list done, the budget decision is already made when the sale gets busy.
See contribution margin before you raise the budget
MlabsGrowth looks at your margins, offers, product pages and checkout together, so each holiday budget decision is judged on contribution per order, not just on platform ROAS.
Raise conversion without buying more traffic or book a 30-minute call.
Frequently asked questions
What is the difference between CM1, CM2 and CM3?
CM1 is net revenue minus product cost. CM2 subtracts variable order costs such as shipping, payment fees and a returns allowance. CM3 subtracts advertising. Naming varies by company, and some teams stop at two levels, so write down which costs sit in each level and use the same definition all season.
Is contribution margin the same as gross margin?
Not usually. Gross margin typically stops at product cost, which is closer to CM1. Contribution margin keeps subtracting costs that rise with every order, including fulfilment, payment fees and returns, and sometimes advertising. That is why a product with a healthy gross margin can still lose money after a paid sale.
How do I calculate break-even ROAS from contribution margin?
Divide 1 by CM2 as a share of net revenue, where CM2 is the margin before ad spend. If CM2 is 44.4% of net revenue, break-even ROAS is 1 divided by 0.444, or about 2.25. Use revenue net of tax and discounts, in the same definition your ad platform reports.
What ROAS should I target during the holidays?
Set it above break-even by the profit you want to keep. Divide 1 by your CM2 percentage minus your target CM3 percentage. With a 44.4% CM2 and a 15% CM3 goal, the target is about 3.40. Recalculate it whenever discount depth, shipping cost or the returns allowance changes.
How often should I review holiday ad spend against contribution?
Daily during the live sale week, using reconciled store orders rather than only platform dashboards, and avoid judging a campaign on a partial day. Returns arrive later, so apply a returns allowance now and true it up against actual refunds in December and January.
Source notes
- About Target ROAS bidding. Google Ads Help. Accessed 1 October 2026.
- About conversions with cart data. Google Ads Help. Accessed 1 October 2026.
- Provide cost of goods sold (COGS) feed attribute to report on profit margins. Google Ads Help. Accessed 1 October 2026.
- Simplifying Ad Measurement for a Social-First World. Meta for Business, published 3 March 2026. Accessed 1 October 2026.
- About Attribution Models and Attribution Settings. Meta Business Help Center. Accessed 1 October 2026.
- Profit reports. Shopify Help Center. Accessed 1 October 2026.
- Consumers Expected to Return Nearly $850 Billion in Merchandise in 2025. NRF, published 15 October 2025. Accessed 1 October 2026.
